Market Overview
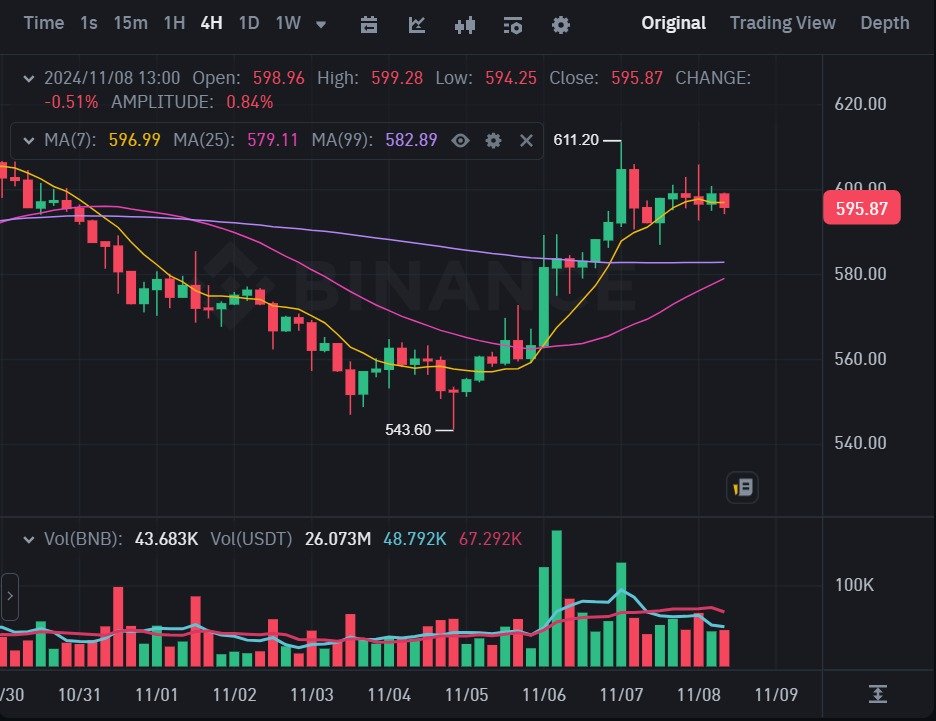
The BNB/USDT 4-hour chart indicates a period of significant market movement over the past week. The current price is $595.87, showing a slight decrease of 0.51% from the previous close. The market has experienced both upward and downward swings, with notable support and resistance levels being tested.
Moving Averages (MA)
- MA(7): The 7-period moving average is currently at $596.99, closely following the price trend. This suggests a recent minor downtrend as the price trades slightly below this level.
- MA(25): The 25-period moving average sits at $579.11 and has acted as a strong support level during the upward movement from November 3rd to November 7th.
- MA(99): The 99-period moving average is at $582.89, indicating a longer-term support that has historically held strong, giving confidence to bullish traders.
Key Levels
- Support Level: The major support at $543.60 (marked on November 1st) indicates where buyers have stepped in significantly.
- Resistance Level: The recent high of $611.20, recorded on November 7th, has emerged as a near-term resistance. If the price breaks above this level, it could signal further bullish momentum.
Trend Analysis
The chart reveals an upward trend from November 3rd, where the price began to rise from the support level of $543.60 and peaked at $611.20 on November 7th. The current consolidation suggests a potential pullback, but the price remains above the 25-period and 99-period MAs, indicating that the longer-term bullish trend may still be intact.
Volume Analysis
The volume indicator shows substantial activity during the rally between November 5th and November 7th, with a peak in trading volume signaling strong buyer interest. However, the declining volume seen on November 8th suggests a possible weakening of momentum as the price consolidates.
Potential Scenarios
- Bullish Scenario: If the price manages to break above the $611.20 resistance, it could signal a continuation of the upward trend, targeting the next resistance around $620.
- Bearish Scenario: If the price falls below the 25-period moving average of $579.11 and the 99-period MA of $582.89, we may see a deeper retracement towards the $543.60 support zone.
Conclusion
The current price action in the BNB/USDT chart suggests a cautious outlook. While there is potential for further bullish movement if the $611.20 resistance is broken, traders should watch the volume trends and monitor key support levels to assess the sustainability of any upward move.
Call to Action
For those looking to optimize their crypto trading strategies, consider utilizing Lumina Lore’s expert copy trading services and advanced trading bots. Visit our website to explore how we can enhance your investment approach. Ready to trade on Binance? Use our referral link to get started and join the future of crypto trading today!